
This post was written by Chris O’Dell co-author of Team Guide to Software Releasability.

Discover the acclaimed Team Guides for Software – practical books on operability, business metrics, testability, releasability
It started with a simple question: “Is there any interest in a mapping camp?”. Simon Wardley wondered if it would be worthwhile organising a free evening meetup about mapping and it quickly became apparent that a meetup would not be sufficient. With the help of enthusiastic volunteers, the first Map Camp took place last Thursday.
Toying with the idea of a mapping camp – 3.5 hour tutorial + some speakers, late Sept, in London – need volunteers, sponsors. Any interest?
— swardley (@swardley) February 2, 2017
//platform.twitter.com/widgets.js
I had stumbled upon Simon’s mapping in the past, found it very interesting, but never had much opportunity to take it any further. The schedule was split into talks and Unconference spaces running side by side. As a beginner, I chose to attend the talks and I was very happy that the first session was a tutorial on mapping from Simon.
Tutorial: Crossing the River by Feeling the Stones

To describe why mapping is important, Simon starts by layering “the two types of why”, Sun Tzu’s Five Factors and John Boyd’s OODA Loop:
Maps assist in the Observe section of the loop. They allow us to define the landscape – see what’s at play, and identify the climate – the unchangeable rules which influence the game. Once we have this map we can confidently move on to the next phase.

Simon uses the example of playing chess without ever having seen a board (and so without the grid locations either). Strategies would evolve and reasons for success would be devised from the moves. But, even an expert would lose against someone who could see the board – someone who had the map.Simon defines a map as having 6 basic elements: visual representation, context specific, position of components relative to some form of anchor and movement of those components. Most tools neglect to include one or two of these elements and so miss some vital information needed before moving into the Orient phase.
At registration each attendee was given a multi-page handout which was the example scenario for the workshop. The scenario is a typical company with sizeable market share, competitors, potential new markets, opportunities for optimising production costs and other possible directions of focus. The handout included the theoretical company’s chosen priorities. With little or no knowledge of mapping we decided our own priorities. Simon later revealed his map for the company and with this new way of looking at the information we revised our priority list.

It was a great exercise – the map completely changed my chosen order and I feel far more confident in my final chosen list. I highly recommend taking a similar exercise yourself. Leading Edge Forum – the main event sponsors, host an online course at http://learn.leadingedgeforum.com
Mapping Governments
The talks were each 30 minutes long and a common theme was government. At least half of the talks included case studies from government departments including Julie Pierce, Director Openness at the Food Standards Agency. Julie talked about how mapping enabled them to clearly see unnecessary duplication and where the use of multiple IT contracts was more a hindrance to change than an enabler.

Liam Maxwell, National Technology Advisor for HM government discussed that mapping helped them realise that they could learn a lot from other governments – it is not competitive. They discovered a tendency to try and apply the same methodologies throughout government regardless of the maturity. Mapping allowed them to define which areas are still in Genesis, and so would benefit from agile, and which are in Commodity where Six Sigma is more applicable. Using techniques from agile methodologies they also put together the tooling for a Minimum Viable Agency.
Hadley Beeman, Architect for #opendata & #openstandards at the W3C gave us insight into the standards process. She showed how mapping provides a visualisation of the differing processes used at different evolutionary stages of a standard. Too much governance on an emerging standard can destroy innovation and too little governance on a standard entering Utility can lead to something which is ill defined and difficult to adopt.

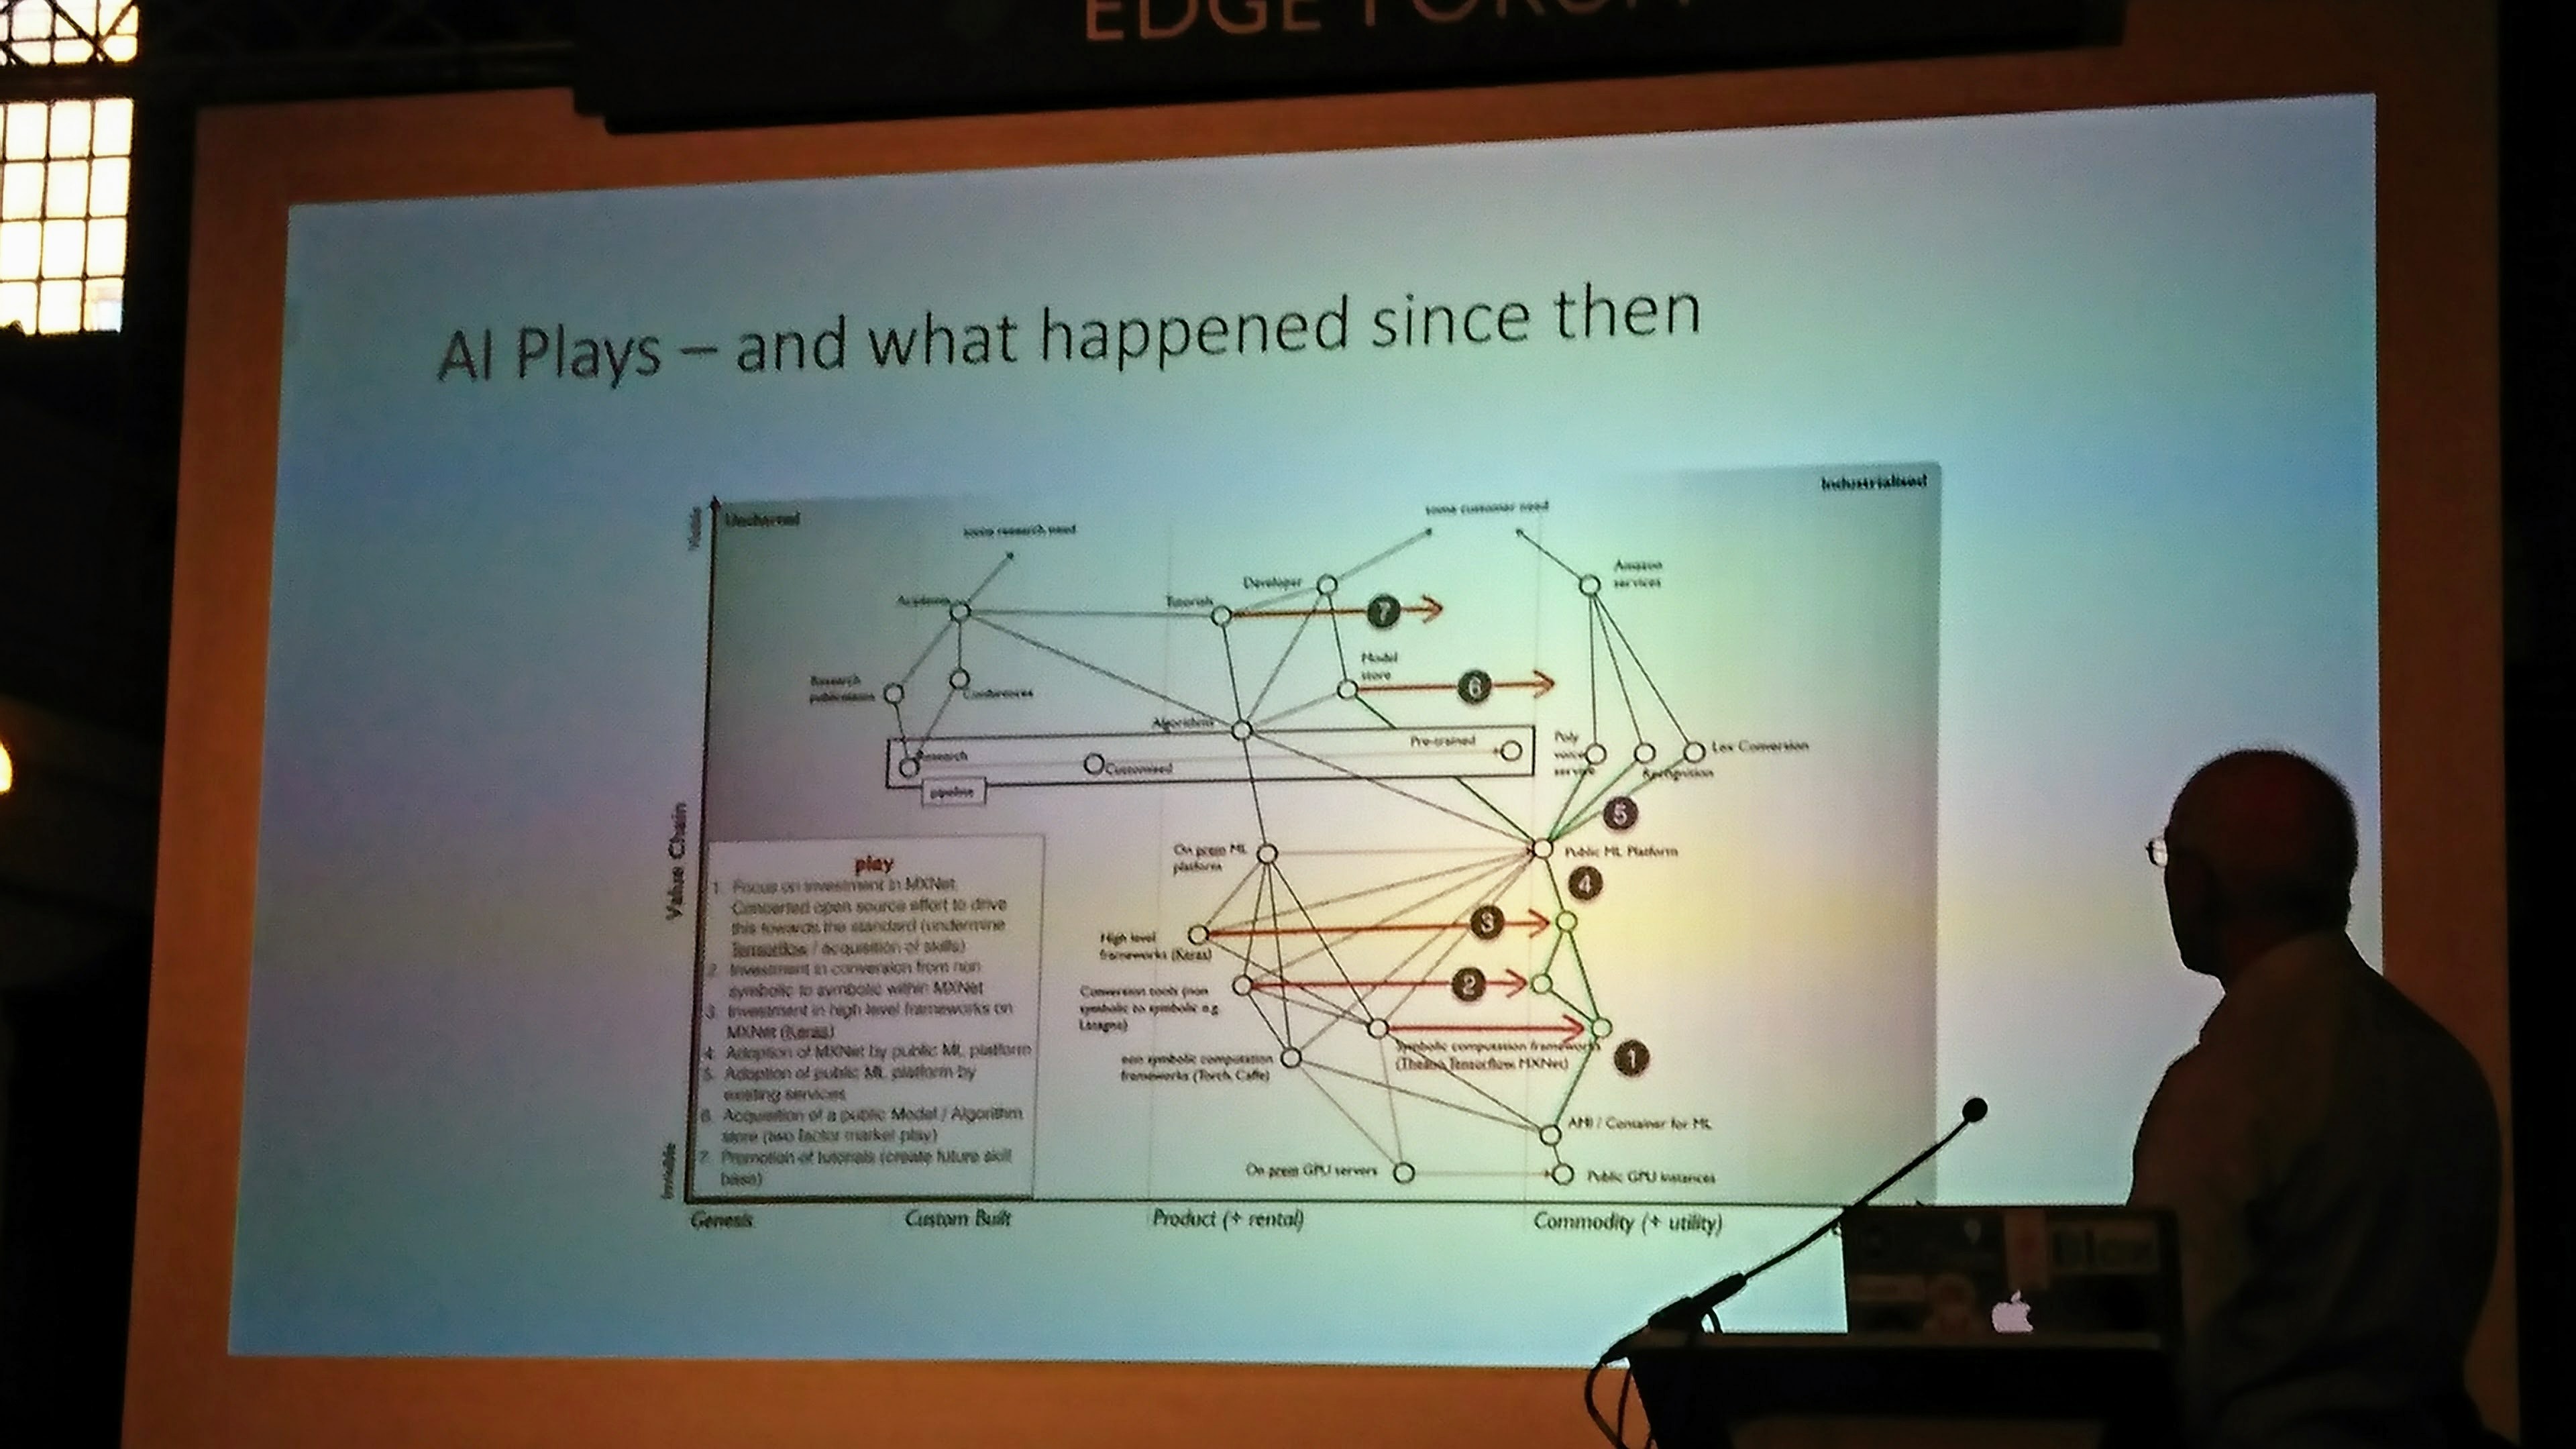
A last minute schedule change meant that Adrian Cockcroft, VP of Cloud Architecture Strategy at AWS, gave us an insight into how mapping helped AWS with their strategy for their new Artificial Intelligence offering. With guidance from Simon, Adrian was able to discern which areas should be focused on first.
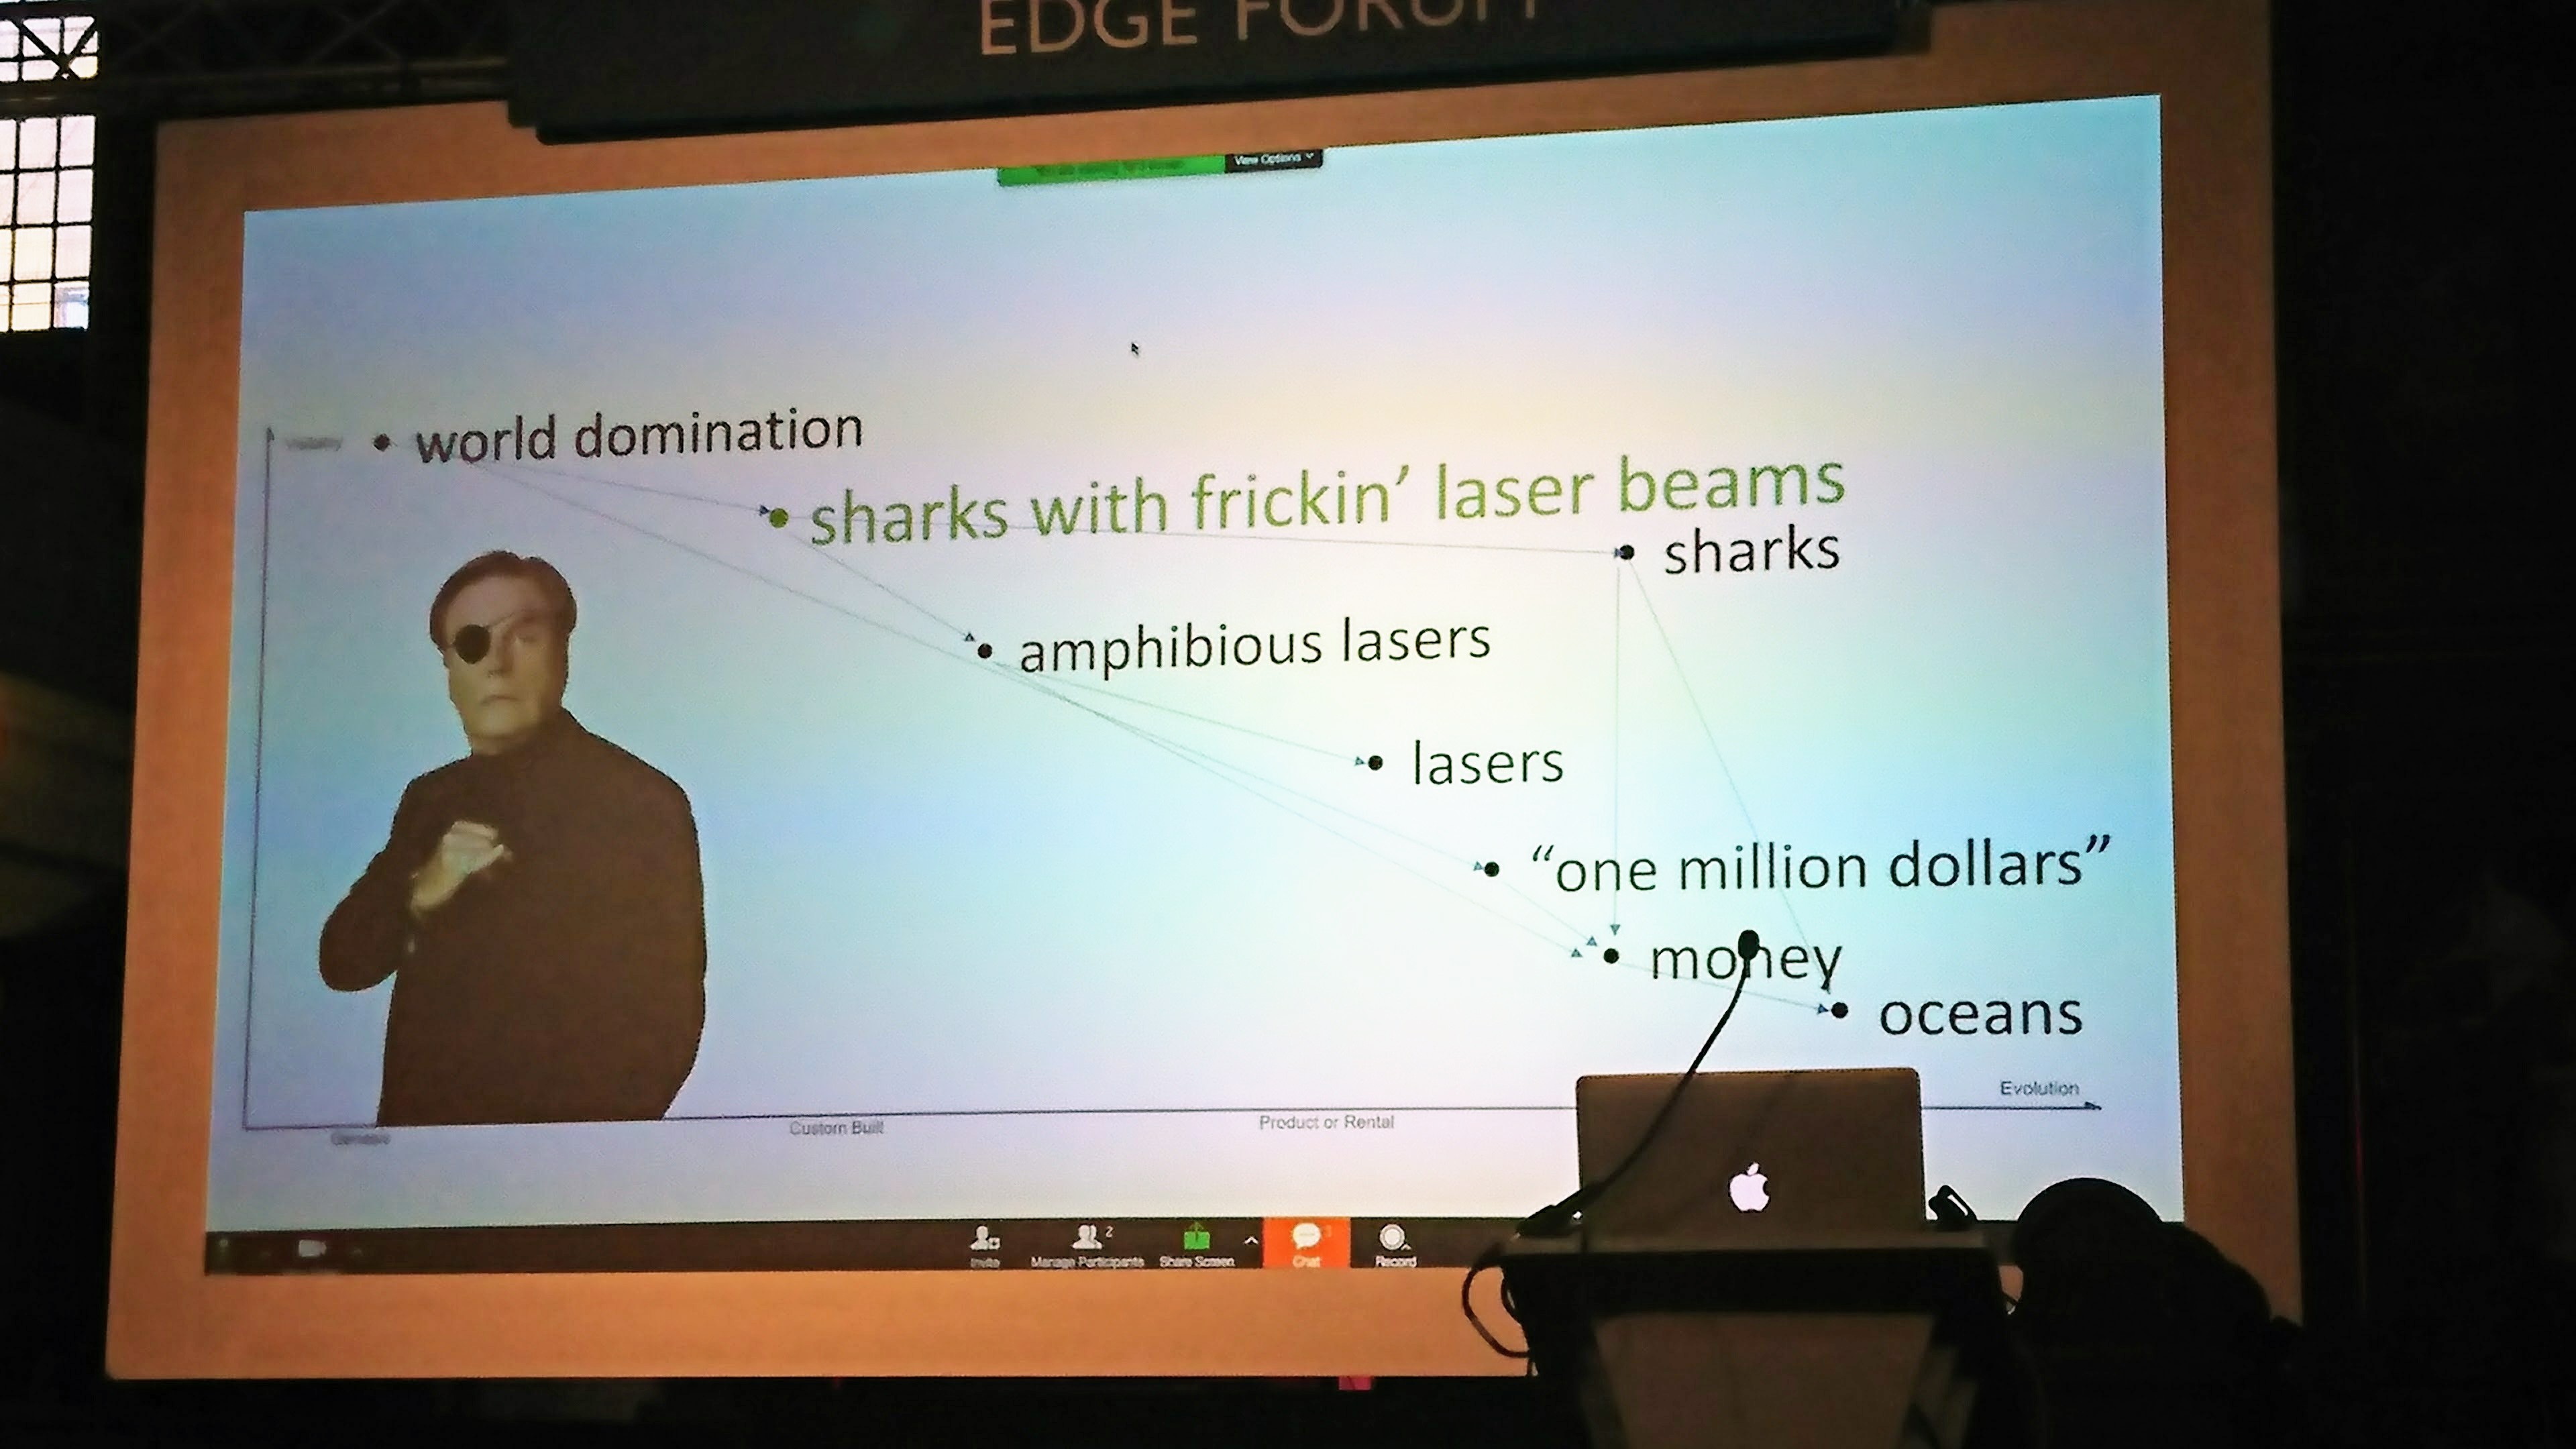
The day finished with a remote presentation from Tal Klein, Author of The Punch Escrow. Tal used mapping to extrapolate ideas of technology in the future which he uses in his book. He also used mapping to clearly demonstrate why sharks with laser beams was a flawed world domination strategy…!
A long, and good day
For an event which started from a single tweet it was packed with content. A 2 and a half hour tutorial followed by 10 half hour talks. I really enjoyed the shorter 30 minute talk slot – speakers pack in the most interesting bits of content – but as an attendee I would have appreciated more breaks between talks.
Due to the organisers’ commitment to hosting a diverse event, I was lucky enough to secure a ticket – and so I want add a special thanks to them. Mapping is a fantastic tool and I will be using it much more in future decision making. I’m looking forward to Map Camp 2018.
