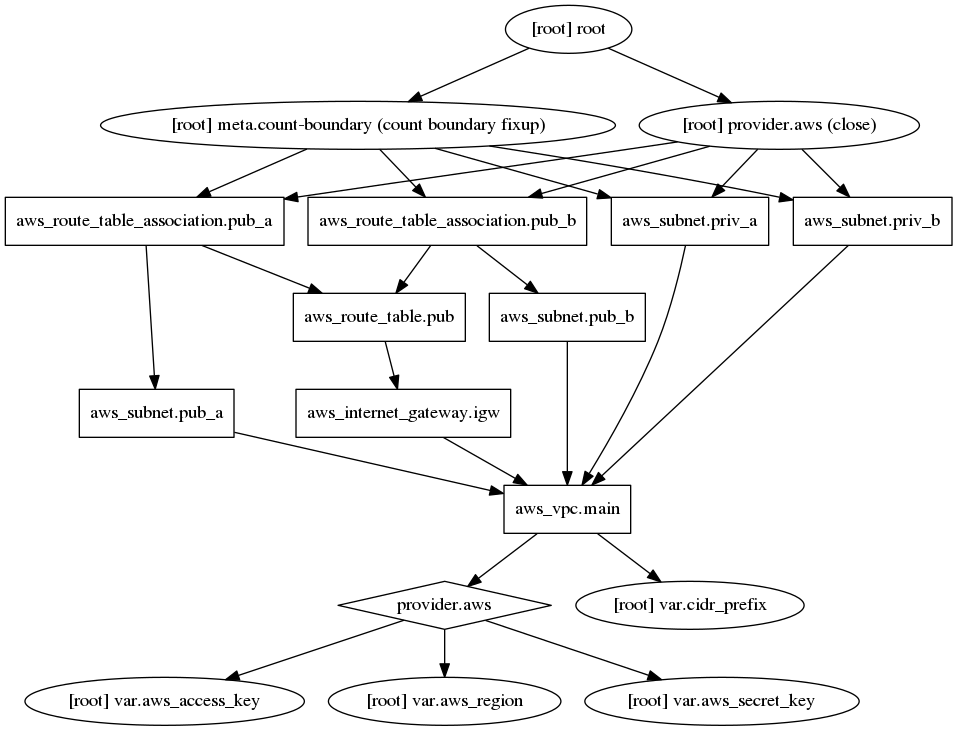
This post was written by Rich Bosomworth. Information visualisation is used for visually representing data to reinforce and enhance cognition. When deploying infrastructure as code, this visual perspective of resources and their relationships can prove useful, both at the design stage, and also post deployment for purposes of troubleshooting and infrastructure development. In this postContinue reading “Auto-generated infrastructure node graphs from Terraform plans”
-
Subscribe
Subscribed
Already have a WordPress.com account? Log in now.
